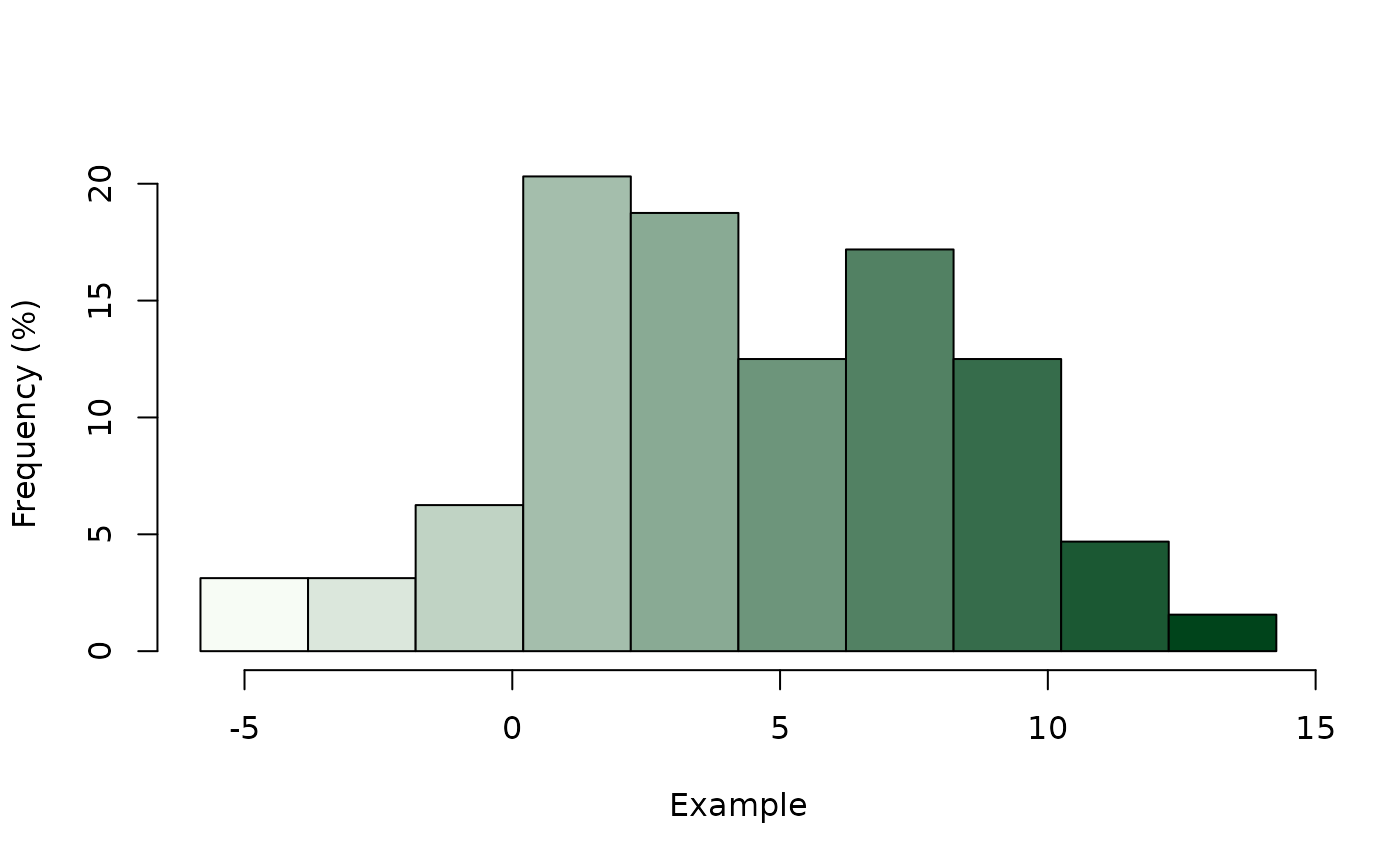
Called by the plot_hist module in the example app and extracts values from a raster image, returning a histogram of density
plot_hist(raster, bins, palette, name, logger = NULL)Arguments
- raster
SpatRaster object
- bins
The number of breaks in the histogram
- palette
character. The colour palette to use
- name
character. The name of the variable
- logger
Stores all notification messages to be displayed in the Log Window. Insert the logger reactive list here for running in shiny, otherwise leave the default NULL
Value
a function that generates a histogram
Examples
if (check_suggests(example = TRUE)) {
  raster <- terra::rast(ncol = 8, nrow = 8)
  raster[] <- sapply(1:terra::ncell(raster), function(x){
    rnorm(1, ifelse(x %% 8 != 0, x %% 8, 8), 3)})
  histogram <- plot_hist(raster, bins = 10, palette = "Greens", name = "Example")
  histogram()
} else {
  message('reinstall with install.packages("shinyscholar", dependencies = TRUE)
  to run this example')
}